


Tactile Graphs
Have fun surveying your friends and family, then turn your data into a bar graph or pie chart.
Favorites Survey
Ask your friends, family members, or classmates about their favorite ANYTHING — their favorite fruit, ice cream, or even their favorite hobby.
Here's an example question we asked 40 people. Which is your favorite fruit: a banana, apple, strawberry, or peach?
Favorite Fruit | Number of People |
Banana | 16 |
Apple | 8 |
Strawberry | 12 |
Peach | 4 |
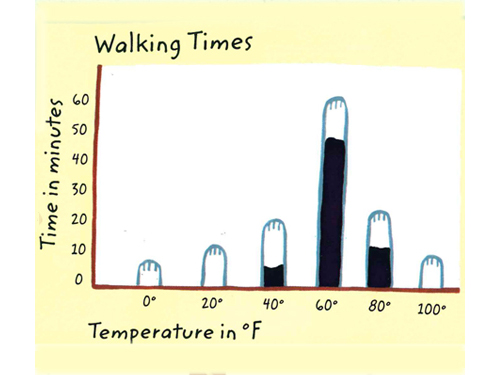
Let's graph the answers in a bar graph! A bar graph uses bars (rectangles) to show data in a way that makes comparing different amounts easy. Bar graphs have a horizontal line (called the x-axis), that runs in the left-right direction. At the left end of the horizontal line there is vertical line (called the y-axis), that runs in the up-down direction.
The horizontal line shows the categories being measured (the types of fruit) and the vertical line shows the amounts of the measurements (how many people like each fruit).
Your bar graph will have 4 vertical bars (one each for banana, apple, strawberry, and peach) that stand on the horizontal axis. The height of each bar will depend on how many people chose that fruit as their favorite fruit.
What You'll Need
Turn Your Favorite Fruit Survey Data into a Bar Graph
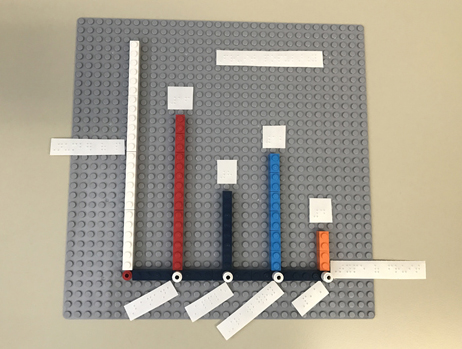
- 1. Make a horizontal axis on the baseplate by attaching a row of single-dot-wide LEGO pieces. Put a single-dot piece at the leftmost position of the row to represent zero. Label the row "Type of fruit."
- 2. Divide the horizontal axis into 4 evenly-spaced sections. Mark the start of each section with a single-dot LEGO piece. Add a braille label to each section for Banana, Apple, Strawberry, and Peach.
- 3. Make a vertical axis on the baseplate by attaching a column of single-dot-wide LEGO pieces, right above the zero marker. The column height should be at least 16 dots tall. Label the column "Number of people."
- 4. Use single-dot-wide LEGO pieces to create a vertical bar above each fruit name on the horizontal axis. Each bar should be as tall as the corresponding number of dots on the vertical axis. For example, 16 people liked banana best, so the bar for banana should be as tall as 16 dots. Label each bar with the number it represents (16, 8, 12, and 4).
- 5. Name your bar graph "Fruit popularity"
Now, let's graph the answers in a pie chart!
A pie chart is a circle divided into sections, with each section representing part of the circle. It's called a pie chart because it looks like a pie cut into different sized pieces. In your pie chart, your circle will have 4 pieces: one each for banana, apple, strawberry, and peach. The size of each piece will depend on how many people chose that fruit as their favorite fruit.
What You'll Need
Turn Your Favorite Fruit Survey Data into a Pie Chart
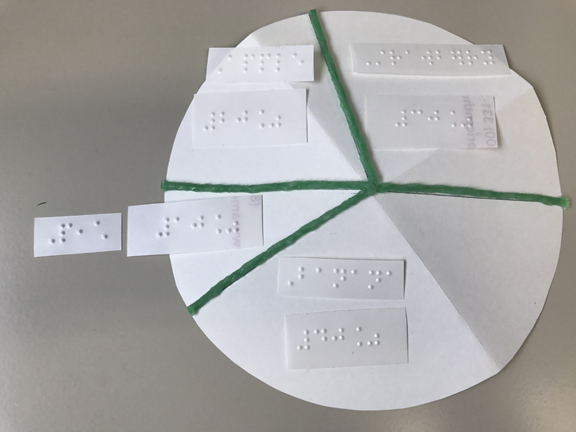
- 1. Fold your paper circle in half once and crease the edge. Fold it in half again and crease the edge. Open the circle up and lay it on a flat surface.
- 2. Figure out how big each pie piece will be. Divide each number (16, 8, 12, and 4) by the total number of people surveyed (40) and multiply by 360 (because there are 360° in a circle).
Banana: 16 ÷ 40 x 360° = 144°
Apple: 8 ÷ 40 x 360° = 72°
Strawberry: 12 ÷ 40 x 360° = 108°
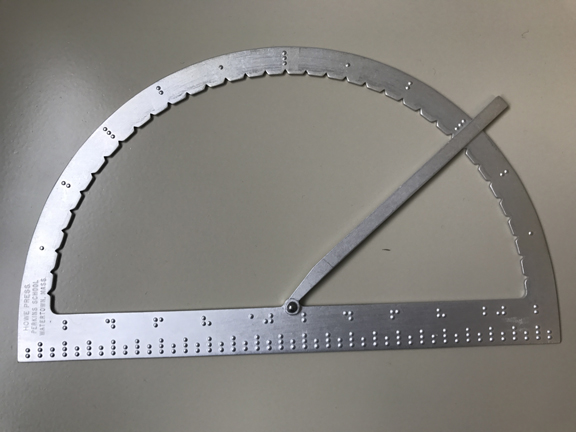
Peach: 4 ÷ 40 x 360° = 36° - 3. Place your accessible protractor on your circle so that the center dot is in the circle's center and the bottom interior edge is on the crease line. Measure the smallest angle (36°) and mark the line with Wikki Stix.
- 4. Rotate your circle to line up the protractor with the Wikki Stix line. Measure the next largest angle (72°) and mark the line with Wikki Stix. Repeat this process until all 4 angles are marked.
- 5. Figure out what percent each section is of the entire circle: Part ÷ Whole x 100 = Percent.
Banana: 16 ÷ 40 x 100 = 40%
Apple: 8 ÷ 40 x 100 = 20%
Strawberry: 12 ÷ 40 x 100 = 30%
Peach: 4 ÷ 40 x 100 = 10% - 6. Label each pie piece with the name of fruit it represents and its percentage of the whole.
This activity was created by Kesel Wilson for Great Expectations.